[14]
STOCK TRACKER
▓ TIER B · YEAR 2026 · STATUS: LIVE · LANGUAGES: TYPESCRIPT
Financial engines as pure functions, test-first and model-free
[FIG. 1] MISSION
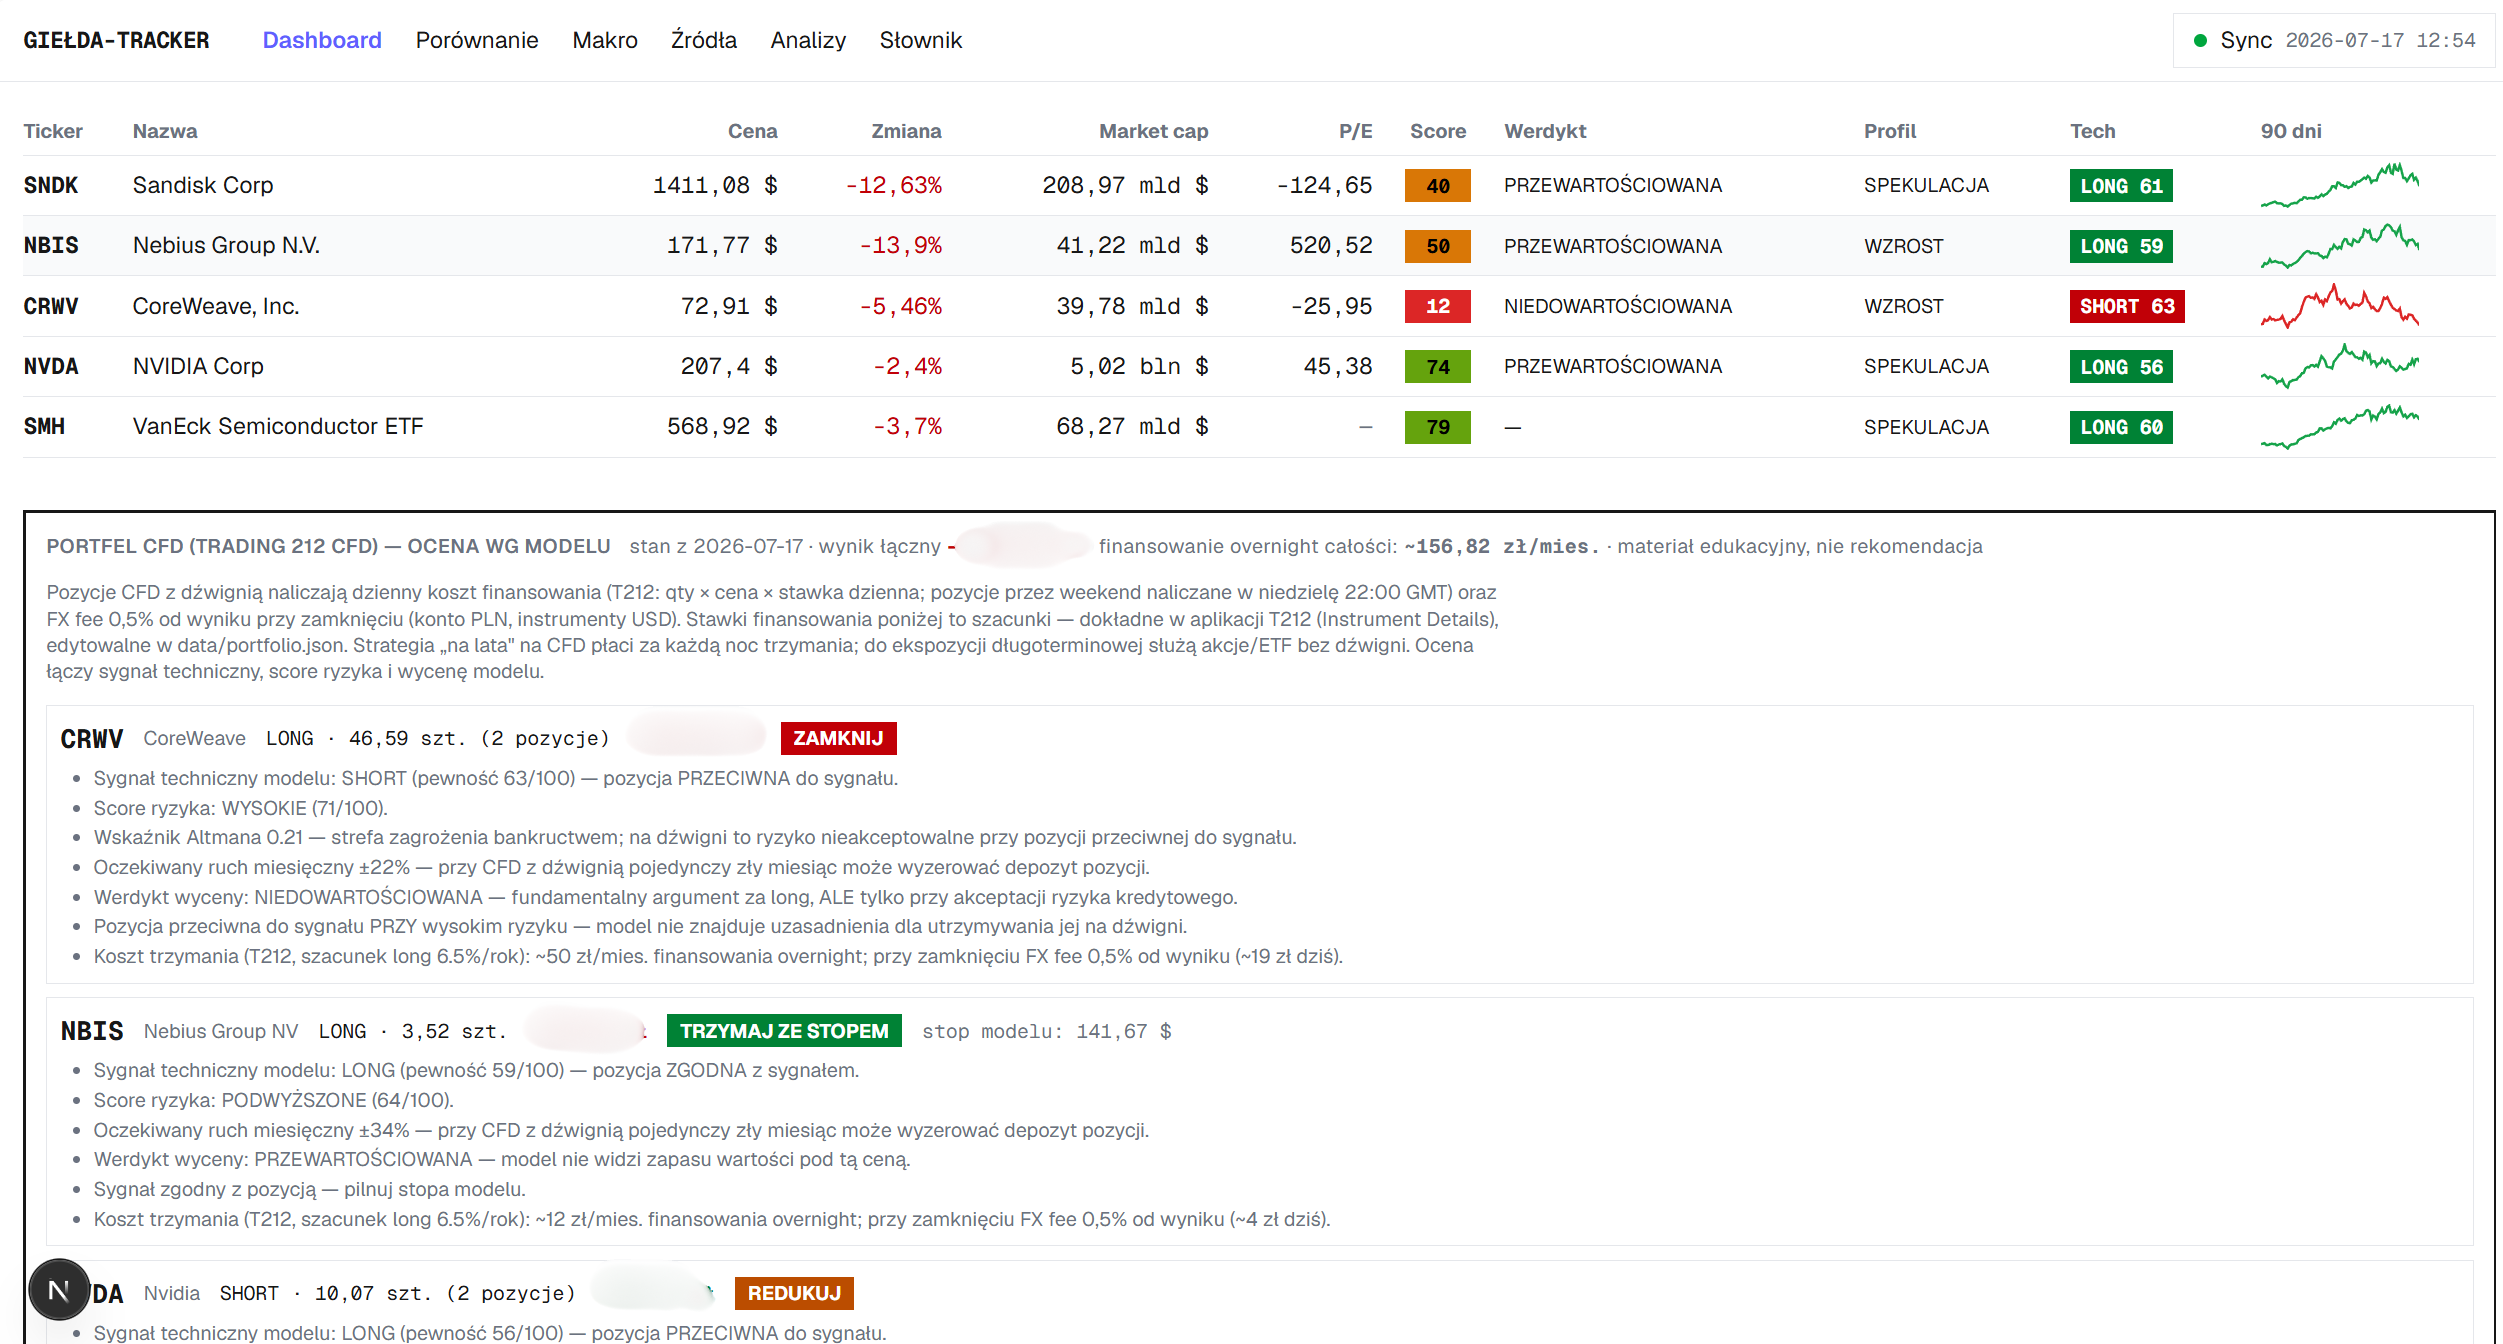
I build computing engines as pure functions, because a financial result has to be reproducible to the cent — and I deliberately keep a language model out of that place. An investment analysis can be killed by 51 data points scattered across 38 sources and paid terminals, so I built a local app that pulls several independent free APIs (SEC EDGAR, Yahoo, Finnhub, FMP, FRED) into SQLite and computes indicators, a composite score, DCF, multiples and DDM valuation models and a LONG/SHORT/NEUTRAL technical signal with engines of my own. I design the flow as one-directional and separate it in time: sync fetches raw data, recompute recalculates everything into one table, and the UI renders from the database only. Degradation is part of the design, not an accident: a missing key or an exhausted API budget ends in a banner, never an error. I wrote the computing engines test-first — 206 cases with canonical values (RSI 70.46, DCF iv≈37.85) existed before the implementation — and I close the whole thing with tests and an accessibility audit (Vitest, Playwright with axe). What broke taught me the most: FMP's free tier returned HTTP 402 for all my tickers, and SEC filings falsified year labels — today fundamentals come from EDGAR, and the parser derives periods from fact dates, not from the fy/fp fields.
[FIG. 2] ARCHITECTURE
hover a block to see its description
[FIG. 3] CHALLENGES
[+][CH-01]
The plan assumed FMP as the main source of statements, prices and ratios — and the free tier returned HTTP 402 “not available under your current subscription” for all my tickers on a live sync; only the profile endpoint worked. Instead of paying up, I split the sources per role: fundamentals from SEC EDGAR (the plan's fallback promoted to the main path), EOD prices from the unofficial Yahoo API, live quote and news from Finnhub, FMP reduced to the company profile. Peer ratios are computed locally from the same data. Along the way I reconstructed the missing EBITDA from XBRL tags — operating income plus four alternative D&A tags, per period — and not a single planned indicator was dropped.
[+][CH-02]
XBRL filings carry comparatives from prior years, but they all bear the current filing's year in the fy/fp fields — trusting them, 2023 and 2024 metrics would land under an “FY2025” label and silently falsify the fundamental series. The JSON parsed fine, so the bug kept pretending not to exist; a test on a fixture from a real filing finally caught it. The parser now derives the period from the end−start window length and the form type, rejecting out-of-range windows (a quarter inside an annual filing, YTD) — a lesson that “valid format” and “true data” are two different tests.
[+][CH-03]
The technical layer tempts you to throw in everything with a name: MACD, Ichimoku, Supertrend, SAR. I did the opposite — accepted 19 indicators and rejected 13 with written justification, and the signal's direction is computed only from factors backed by peer-reviewed research (12-1 momentum, 52-week high, MA200 trend, volatility management). A walk-forward sanity check scored 6/8 — and I deliberately do NOT calibrate thresholds on it, because eight observations are an anecdote, not a sample. That statistical honesty is built into the product.
[FIG. 4] AI LAYER
No language model runs at runtime — every engine is a deterministic pure TypeScript function, and that's deliberate: numbers in investment analysis must be reproducible to the cent. AI built the app itself, though: 63 commits in about 14 hours of a single day, in a /loop over the backlog, with a spec-first package of ten documents and canonical formulas written down before the code.
[FIG. 5] GALLERY